The Trading Strategy Development Phase – Defining Entry and Exit Conditions on In-Sample Data
- Petr Tmej
- Jul 15, 2022
- 16 min read

Trading Strategy development
Let’s consider that you already realized that you are at a disadvantage as a discretionary trader as you don’t want to trade randomly anymore. Let’s talk about the issues and potential pitfalls you will face. Hopefully, this will help you to avoid these pitfalls at the beginning and potentially save you your trading capital.
Algorithmic trading can be challenging, especially when you are just starting since there are seemingly many things to look out for. Now, I am going to cover some of the biggest and most common algorithmic trading mistakes. Avoiding all of these mistakes can lead to a significant improvement in your trading performance.
When developing a trading strategy, you use historical data to test your algorithm and analyze its past performance. This analysis gives you great feedback on how good or bad your strategy would have performed over the chosen period.
Even though backtesting is a great tool that is fundamental for any algorithmic trader, it can also be dangerous. If done incorrectly, backtesting can be very dangerous because you could get false, too optimistic performance.

Historical Data LengtH
What length of historical data to use? It could be said that the longer the historical data, the better. But is it worth using them, for example, for the development of data from the 1990s, when the markets were in principle completely different, and trading volumes were many times lower?
Plus, where to get really relevant data? As already mentioned, the TradeStation platform offers high-quality intraday historical data for futures markets.
For stock indices and bonds, we recommend working with historical data from 2003 or from 2006 to. It is true that data may be obsolete before this date, but in essence, nothing significant will happen if you use pre-2006 data for development. For all other markets such as metals, energy, grains, or softs, we recommend working with data from 2007.
Combining futures contracts into one time series
Every futures contract has a lifespan. Unlike stocks and forex, which are forming one continuous time series, in order to perform backtesting futures contracts must be so-called adjusted – that is, they combine contracts into one time series so that the most liquid contracts follow each other in time.
Continuous futures data are linked at Turning points.
Turning Points
Transition points are determined using the Open Interest indicator. When the Open Interest value of the next futures contract exceeds the value of the current futures contract, a transition point occurs, and the time series continues with the values of the new contract. There are general rules specific to each market that describe when these typical transition points occur
So if the Open Interest of the next Russell 2000 contract exceeds the value of the current S&P 500 contract on the sixth trading day before it expires, TradeStation Network interprets the transition point to the new contract on that day.
Once the transition point is reached, the data must be adjusted. TradeStation performs the adjustment by adding or subtracting a constant to the current futures contract to the historical data up to the beginning of the historical data. In our case, Russell 2000 until the beginning of 2006.
The issue of creating continuous futures data is relatively extensive, and other methods can define transition points.
Merging futures data in the TradeStation platform
However, the contract bundling performed by TradeStation is certainly sufficient and it is great that the platform will make it much easier for us. Now let’s look at how to retrieve historical data for the E-mini Russell 2000 market in the platform.
Let’s sum up the key points:
In the Format Symbol tab (Edit Symbol for TradeStation version 10), in the Symbol field, define the connected E-mini Russell 2000 contract with the at sign @ and ticker (RTY), or @RTY (in the case of the Rusell 2000 Micro contract (@ M2Y)
The bar interval, i.e., the timeframe, is set to 60min
In the Range field, we define the start date to 1.1.2006, i.e., Jan / 01/2006 (01/01/2006)
The Last date is defined for the current day you are on
We want to display the time zone of the stock exchange, so we leave the Exchange field (Local would mean generating historical data for your time zone and avoid it)
In the Properties tab, define your own session from 08:45 a.m. to 03:03 p.m. from Monday to Friday (from 8:45 to 15:03 stock exchange time)
For backtesting, we only need to join the @RTY contract (Micro @ M2Y)
But if we want to trade live, the expiration of a futures contract for stock indices is
o H – March
o M – June
o U – September
o Z – December
So if we want to trade live, for example, a contract expiring in March 2021, our symbol will be defined as @ RTYH21 (@ M2YH21)
Advice: Never forget to merge futures data to one continuous contract. And be sure you do it the right way. Or simply use the TradeStation platform for that. It works well.
Easy Language - the programming language of the TradeStation platform for non-programmers (as well as Multicharts)
It is funny how algorithmic trading seems so inaccessible to a trader who deals with discretionary trading. People are simply afraid of change, but only those who can step out of their comfort zone and improve are destined to win.
The basic motivation for the creation of EasyLanguage was the vision that algorithmic trading should be accessible to traders who are not skilled programmers. After all, I am a clear proof that working with EasyLanguage is relatively easy to learn without having any programming background.
In addition, working in EasyLanguage can also be a great gateway to the world of idea-making, to find one’s bearings in the issue. This programming language is practically ideal for these needs, as it is really very easy to understand.
This software contains quite a few different functions, such as Paint Bar (if you meet the conditions, it will color in the price chart bar), etc. Forget this nonsense, which was invented for discretionary traders.
Let’s focus on practice, and that is the creation of strategies. In this book, we will look at the development of a specific example of strategy, i.e., the process from the initial input idea to the output rules of the strategy. In doing so, you will learn programming itself in EasyLanguage. You will see for yourself that this is not difficult!
But first, let’s look at the basic code structure of each strategy, which includes:
Reserved words
Remarks
Variables and Data Types
Inputs
Function
Entry Prices
Entry Conditions
Exit Prices
Exit Conditions
Entry Orders
Exit Orders
If I started to describe the individual meanings to you here now, they would miss. It’s best to go straight to practice, so let’s get to it. But before that, let’s repeat the basic facts and determine exactly how we will work with the price data on which we will develop the strategy.
Let’s repeat that:
We chose the futures stock index E-mini Russell (RTY). The advantage is that if you have smaller capital options, you can also trade the Micro version of this market (M2K).
Timeframe (bar size): 60 min
Business sessions: 08:45 a.m. – 03:03 p.m.
We will develop the strategy on data from 1.1.2006 to 1.7.2015. At the time of writing this, it’s 10.11.2020. Why not use the entire data history, but only until July 2015? We will answer this in another subchapter and it concerns the so-called over-optimization.
Over-optimization
The first backtesting mistake that we’re going to cover is overfitting. Overfitting is the act of over-optimizing your algorithm to the historical data. Imagine you train for Formula One in your training racing circuit. You do it at least a thousand times. You become perfect in that particular circuit. But when you change a circuit, your performance gets worse.
Only the best ones who can adapt to ever-changing racing conditions are true winners. With trading strategies, we have the same problem. We can fit a strategy on training data (in-sample) as much as we can, but without verifying it on different yet similar kinds of data (out-of-sample), we will never know if we have a real winner.
The best example would be to use the simple reversal strategy from the previous chapter. Imagine you have historical data from 2003-2020, and you split it into two parts – the first 70% for the fitting process and 30% for verification. You build and program your trading strategy by using the first 70% (this part of the sample is called the “in-sample or training” data).
Therefore: Based on the market research, you understand how a trading strategy could work and rewrite the idea into an applicable code and obtain an automated trading strategy. In our case, It was the simple 30 bar moving average reversal strategy. We developed the strategy on the first 70% of historical data.
We found out that the 30 moving average strategy has awful performance – not profitable or stable enough. In a standard case, we would stop developing this strategy immediately because it has no potential, likewise like a terrible Formula One racer. If you don’t have talent, just leave that before it kills you.
However, let’s say your father insists you are next Michael Schumacher and wants you to race anyway. For demonstration purposes, let’s try to improve our strategy on training data.
The first thing that can come to your mind is to change the period of moving average. So we tried the length of 1-100 with increment 1. It is called the optimization test. It is practically impossible for a discretionary trader to perform as it would be a very time-consuming process that would take probably years.
We want to maximize Total Net Profit. We call this process optimizing the fitness function or curve fitting, commonly used terms amongst traders. So you repeat the procedure until you obtain satisfactory results (in our case, 100 times, and it is done automatically by an optimization test). We found out that the best lookback period for this moving average is 5:

Figure 1: In-sample data, Source: TradeStation Platform
We optimized this sample for the period from 2003 – 2015. The equity curve looks very unstable (Figure 1), and if we added costs, it would destroy the performance even more — so completely unusable. Yet, let’s look at the out-of-sample (also called test) period from 2015 – 2020 to verify the strategy performance.

Figure 2: Out-of-sample data, Source: TradeStation Platform
As you can see (Figure 2), this is even a bigger disaster. Terrible Formula One racer that is not able to adapt to ever-changing conditions. And it is exactly what nonstationary time series like markets represent. So, we can conclude that the performance of in-sample data from 2003 – 2015 was overfitted. Never develop a strategy on the whole historical data set. A lot of inexperienced traders believe that verification of “out-of-sample” data is a sufficient tool for verifying the viability of trading strategies, but things are more complicated. Even if a strategy provided a good performance on both in-sample and out of sample data, we still need to perform more advanced tests – stress tests or walk forward tests. As you can see, it is not that easy. Let’s dive more deeply into it, but before that, let’s make a quick summary:
Most algorithmic traders make the following mistakes:
They build their strategies on a complete historical data sample. They don’t divide the data into in-sample and out-of-sample sub-samples.
They split the data, but they immediately verify each modification of their strategy on out-of-sample data. The basic rule is to optimize the strategy solely on in-sample data. Only after we are satisfied with the system’s performance we can verify it on out-of-sample data.
Even if the trader does everything right, meaning they built the strategy on in-sample data and then verified its final form on the out-of-sample data, they haven’t won yet. You can never rule out the unpleasant possibility that confirming the system’s stable profitability was just a coincidence. One out-of-sample test simply does not suffice for a statistically relevant conclusion that our trading strategy has predictive abilities and detects correct signals. However, we have a solution to stress and walk-forward testing. These are advanced robustness testing that will be discussed later in this ebook. These tools help us maximize the likelihood of a trading strategy’s intrinsic profitability on unknown data, i.e., in live trading. Such strategies – which we test and develop – are called “robust strategies.”
Of course, the basic assumption is that we test our strategy on relevant historical data from sufficiently liquid markets and use realistic trading cost estimates.
Advice: After some experience, a trader will sooner or later realize that it is tough to develop a trading system that will perform well on valid out-of-sample tests. And it is countless times harder to develop a strategy that will work in live trading as you expect. Take this into account and never give up!
Look-ahead bias
Another common algorithmic trading mistake is using data in your algorithms that aren’t available at the time. Look ahead bias means that your backtest program is using tomorrow’s prices to determine today’s trading signal. Like if you are a Formula One racer and you know ahead precisely what your opponents will do.
It uses future information to predict at the current time. One example is when you use high or low on the same day to enter the market. Simply because before the market’s close, we don’t know the high and low of that day. Using daily highs and lows in your algorithm might seem like an obvious mistake.
Still, there are similar situations that aren’t as obvious. Always make sure that your algorithm only uses information that is known. The worst part about this mistake is that it can be tough to notice it since backtesting won’t help you realize that you’re making this mistake.
An algorithm that uses future data to make decisions will work great in backtesting but terrible with live data since it can’t access future data. One way to avoid this mistake is simulated testing.
Simulated testing is the opposite of backtesting. Instead of using historical data to verify your strategy’s performance, you use live data to test it but without risking any money. Traders often underestimate simulated trading and don’t use it correctly to evaluate whether the backtest is reliable
Advice: Don't forget: Good performance of simulated trading has the same importance as backtest results. Take your time and confirm by proper simulated testing that a strategy has no look-ahead bias.
Trading costs not included (slippage and commissions)
The next major algo trading mistake that is made way too often is not accounting for trade costs. When testing an algorithm, most people account for the apparent trade cost, such as trading commissions and data feeds.
Still, besides these costs, various other trading costs can have a significant impact on your performance. And the cost associated with liquidity is the highest one. In the case of FOREX, you always have to pay the bid/ask spread when you’re opening or closing trades.
Furthermore, depending on your trade volume, you should also account for slippage. Slippage is the difference between the demanded price of a trade and the price at which it is executed.
Slippage can happen at any time but is usually bigger during periods of higher volatility when market orders are used. It can also occur when a large order is executed, but there isn’t enough volume at the chosen price to maintain the current bid/ask spread.
Slippage is a considerable concern for big institutions when they need to make their high volumes trades. But it is a great advantage for small retail traders. They trade tiny volumes and don’t have any capacity constraints. And this is where you can find the opportunity.
Let me show you this example for E-mini Russell 2000 market:
We developed an intraday momentum breakout strategy that exits at the end of a predefined session. It never holds a position overnight. These intraday strategies are especially sensitive to any costs. If trading signals don’t have powerful momentum, it can have an insufficient average trade:
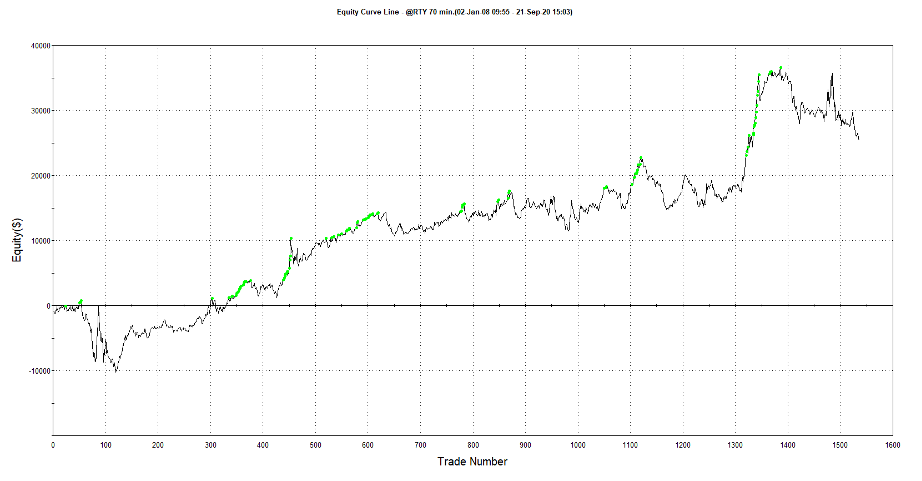

Figure 3: Momentum intraday breakout strategy for E-mini Russell 2000. No slippage and cost included, Source: TradeStation Platform
In Figure 3, you can see that the equity curve doesn’t look well. Yet it made a profit with Average Trade $16.55. Now let’s include round turn slippage and commission for this futures stock index that is $15:


Figure 4: Momentum intraday breakout strategy for E-mini Russell 2000. A realistic round-turn slippage and cost included ($USD)
As you can see in Figure 4, after including round turn slippage and commission, this trading strategy ultimately failed, and in more than 12 years, it didn’t make almost any profit. So with a simple buy and hold strategy for this equity index, you would be the winner.
Advice: Include brokerage commission and slippage in the backtest. Always!
The issue with limit orders
In the case of limit orders, the problem with a simple backtesting engine is that it doesn’t use tick data with market depth to determine if limit order would be filled or not in the backtest. Moreover, it is pretty expensive and hard to find the right data providers with this kind of historical data. However, you, as a retail trader, don’t need to be afraid.
TradeStation provides high-quality intraday data for futures and stock markets, and for retail trader’s needs, it is entirely sufficient. You can develop trading strategies just with market orders due to low slippages, so you don’t need to worry about this.
Advice: As a small retail trader it is better to use market orders rather than limit orders. You don’t need to worry about capacity constraints
Data snooping bias
If you want to develop a potentially profitable trading strategy, the traditional way is very stressful and time-demanding. Many simple strategies that worked during the 90s and beginning of the 21st century do not work anymore.
Trading has become very complex, and you need to use the computational power to develop better strategies than your competitors. In other words, you have to be very creative and educated in terms of the correct strategy building development process.
Whether you do your programming or hire someone else to code your ideas, the development process is time-consuming and complicated. Let’s assume you have an idea to start with. The first step is to identify the strategy’s rules, code it, and verify that the code does what you expect it to do. Unfortunately, most trading strategies simply don’t perform well, which means more programming, more backtesting, and so on.
It is why traders started to use machine learning technologies. These technologies automate the strategy development process. It outputs clean, complete code that includes rules and trading orders for entering the market, exiting at a profit, and exiting at a loss (e.g., money management stops).
And hand in hand with these AI technologies, the problem of data snooping bias has arisen. The data snooping bias is a statistical bias. It appears when exhaustively searching for combinations of variables that will result in profitable patterns in live trading. The probability that a result occurred by chance grows with the number of combinations tested.
These random market patterns are unlikely to recur and have the edge in the future. Hence, a model fitted to those patterns is unlikely to have much predictive power. The way to detect data snooping bias is well known: We should test the model on out of sample data and reject a model that doesn’t pass the out of sample test. But this is easier said than done.
Once the out of sample data is used, it is not out of sample anymore. One simple rule to avoid data snooping is to make a trading strategy as simple as possible, with as few parameters as possible. There are many software and methods out there that can create, backtest, and combine the massive amount of trading rules or trading systems in a very short time.
A lot of combinations will usually ensure good performance on training data where the strategies are fitted. And you might think that you have found your profitable trading strategy and that the only thing you have to do now is to start trading real money using it. But be careful, it is more complicated.
So how to deal with this and choose a strategy that doesn’t suffer from data snooping bias? The more combinations of rules and variables you try, the higher the probability that a good performance result is caused by sheer luck, even out of sample data. But why should we use these machine learning technologies?
The truth is that classic techniques that use indicators and well-known price patterns don’t work anymore. And machine learning technologies can discover exciting patterns that humans would never be able to find.
Unfortunately, if applied incorrectly, machine learning models can run only on random noise in the stock prices.. But what can we do is to minimize the likelihood that the results suffer from the data snooping bias? We can do this using different techniques.
If walk forward and stress tests are applied appropriately on out of sample data, it can significantly minimize the risk of trading overfitted strategy.
Selection bias
Selection bias happens when you backtest so many trading signals that sooner or later, you will find a trading strategy with a promising performance on historical data.
However, the more you try, the higher the probability of finding a trading strategy with no predictive power. It is a typical approach of many algo traders: They use AI technologies like genetic algorithms; for them, it is possible to create and test hundreds and thousands of different rules for entry and exit conditions.
If AI tries enough times, a trader will finally find at least one strategy that performs well over a long time with a demanded stable equity curve and Sharpe ratio. If a trader wants to risk his capital in the market, he should not rely on one nice equity curve. It doesn’t give enough evidence that a strategy will work in live trading.
The reason is that stable profitability could be just because of sheer luck. And if a trading strategy performance is random, it will start to underperform the backtest as soon as a trader goes live with a strategy.
The next problem is with out-of-sample testing: a trader can find a suitable equity curve there too. And again: just because of the sheer luck. This is a typical problem of data mining: the more strategies you develop on in-sample data, the higher the probability you will sooner or later find one that performs well in both in-sample and out-of-sample. Yet, the performance won’t repeat in live trading.
So how can you solve this?
The right starting point is that now you are aware of this bias. The next step is to realize these basic principles:
Before you start building the process, be confident that a trading strategy has a robust theoretical base. If you decide to use a machine learning technology that could help you find profitable patterns, make sure you apply an advanced procedure to measure them’ robustness. Points will be explained in more detail in the chapter Stress & Robustness Tests.
Out-of-sample data is vital for the verification of strategy performance. Once you have developed a strategy on in-sample data, use the out-of-sample data just once to check if it performs similarly. Don’t forget: Never use in-sample data to change a strategy based on the out-of-sample. By doing so, you will overfit a strategy. Note that many ML models need both in-sample and out-of-sample data, in that case make sure you have another untouched out-of-sample.
Keep the number of strategy inputs (parameters) as small as possible. The less, the better.
Survivorship bias
Survivorship bias is a typical type of selection bias. When a trader backtests a portfolio trading strategy on a group of stocks, it should contain companies that went bankrupt or left an exchange.
Eliminating a company from a dataset that stopped trading would input a bias in our data sample. So if you decide to develop a stock-picking portfolio trading strategy for stock markets, be sure that you have a data set containing eliminated companies over history.
If not, you risk getting too optimistic results.
If you don’t want to read all I want to share with you article by article, grab our Ultimate Guide To Successful Algorithmic Trading here and read it anytime you want! 12 chapters, 112 pages: all in one place and completely FREE of charge!
Search
Search
Recent Posts
Topics
Advanced (6)Algorithmic Trading (17)Basics (24)Futures (1)Investing (6)Libraries (1)Python (10)Statistics (1)Stock Market (9)Stock Pairs (2)Strategy Development (16)Time Series (2)Trading (8)volatility (2)
Recent Comments
eyeCrato on Selection of Market or Set Of Markets for Trading, TimeFrame and Trading Session 4/12
eyeCrato on Selection of Market or Set Of Markets for Trading, TimeFrame and Trading Session 4/12
Peter Kostovčík on Correlation approaches for stock pairs you have not seen before
ted thedog on Correlation approaches for stock pairs you have not seen before
Jakub on Trading Stocks Make Sense Post Earnings & Long Bias


Comments